

Prerequisites
Before you begin, make sure you have:- A LangSmith account: Sign up or log in at smith.langchain.com.
- A LangSmith API key: Follow the Create an API key guide.
- An OpenAI API key: Generate this from the OpenAI dashboard.
1. Set up your environment
-
Create a project directory, install the dependencies, and configure the required environment variables:
-
Export your environment variables in your shell:
If you are using Anthropic, use the Anthropic wrapper. If you are using Google Gemini, use the Gemini wrapper. For other providers, use theTo send traces to a specific project, use the
LANGSMITH_PROJECTenvironment variable. If this is not set, LangSmith will create a default tracing project automatically on trace ingestion.@traceabledecorator to trace calls manually.
2. Build the app
The following app uses two LangSmith tools to add tracing:wrap_openai: wraps the OpenAI client so every LLM call is automatically logged as a nested span.@traceable: wraps a function so its inputs, outputs, and any nested spans appear as a single trace in LangSmith.
assistant function calls a tool (get_context) to retrieve relevant context, then passes that context to the model. Using @traceable on both functions captures the full pipeline in one trace, with the tool call and LLM call as nested spans.
Create a file called app.py (or index.ts) with the following code:
3. Run the app
4. View your trace
In the LangSmith UI, go to Tracing and select your default project. Click theassistant row to open the Trace details panel, which shows the assistant function with the get_context tool call and the OpenAI call nested inside it.
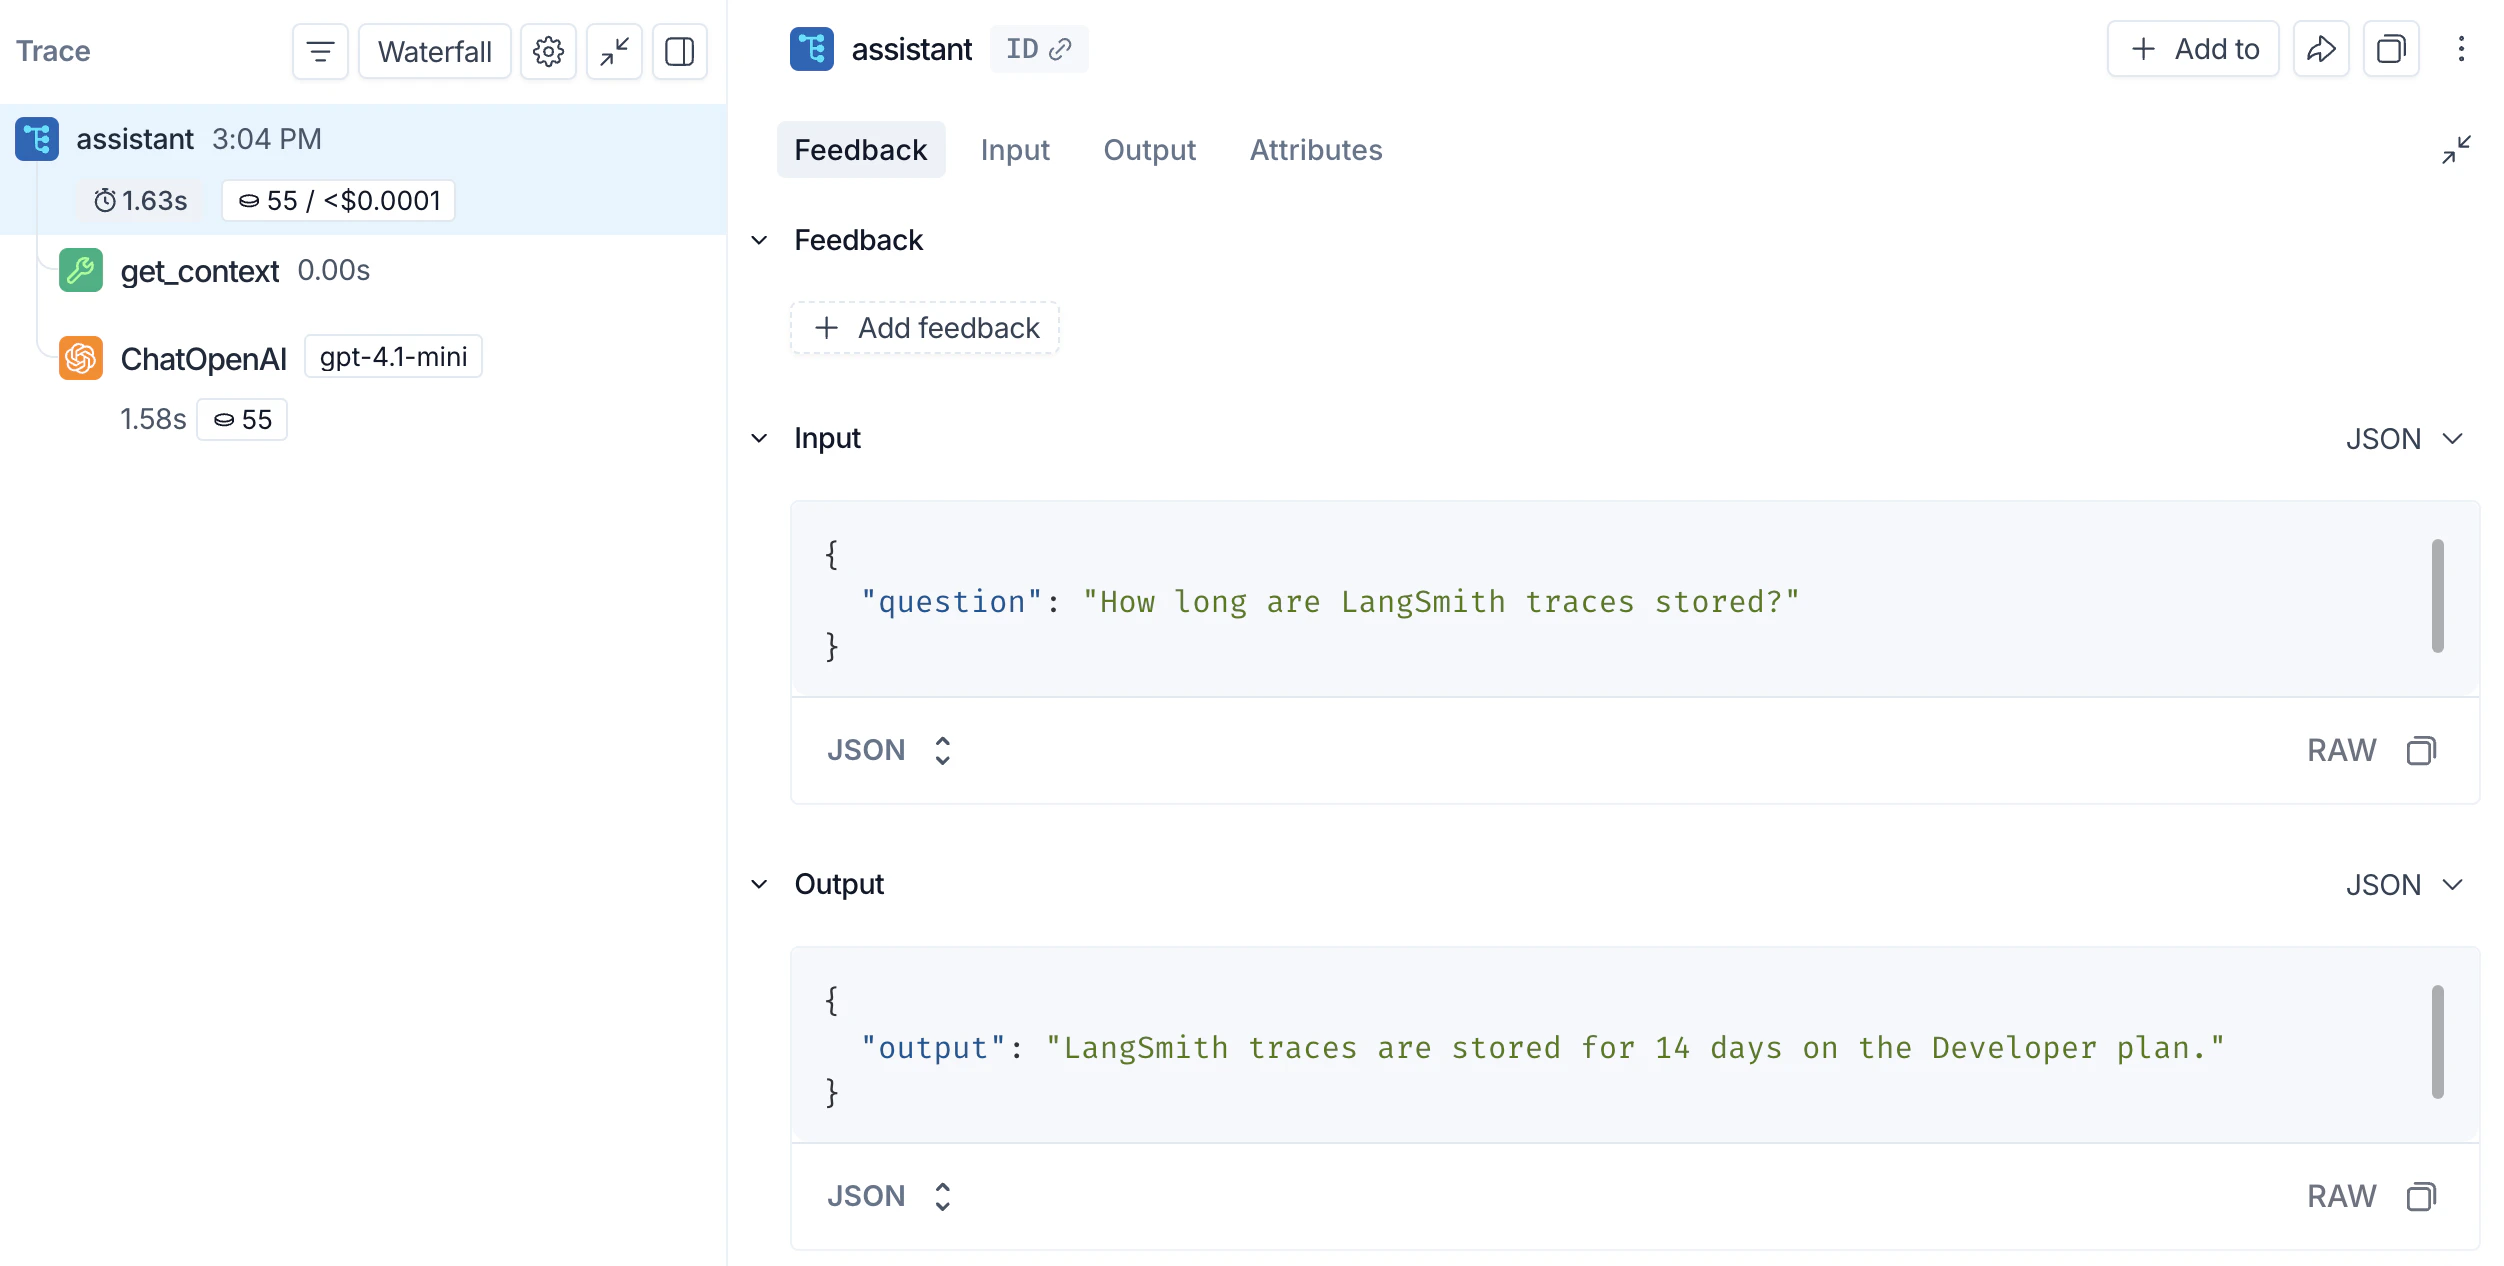
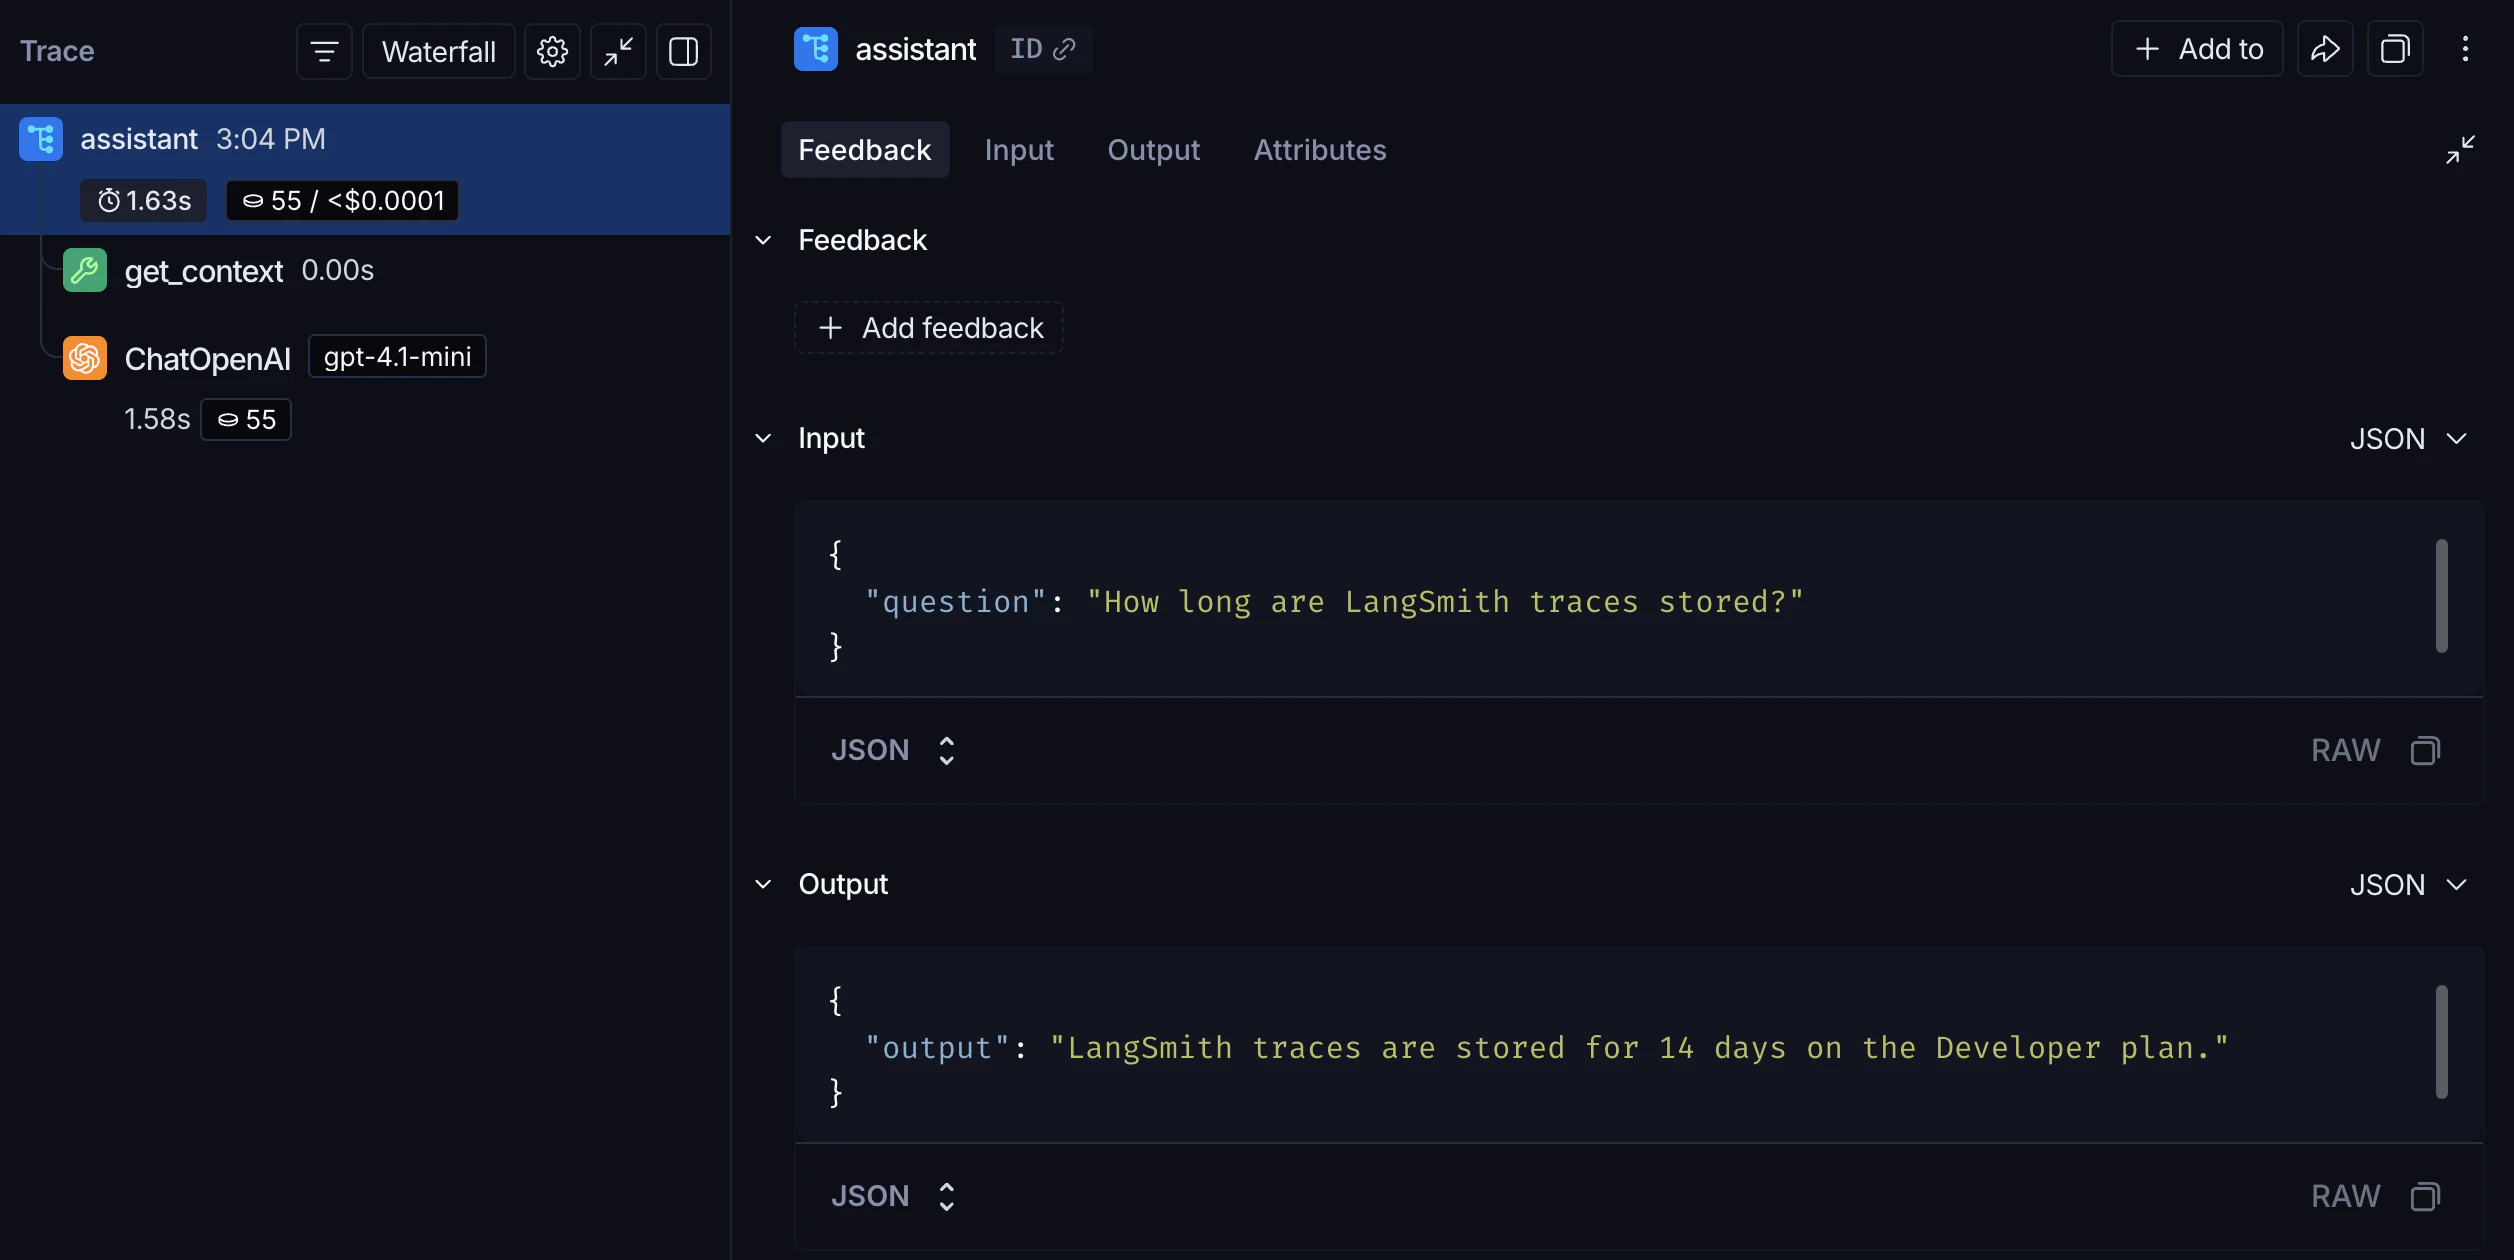
assistant function’s inputs and outputs. The nested get_context span records the tool call, and the ChatOpenAI span records the exact prompt sent to the model and the response returned.
Next steps
- Tracing integrations: LangChain, LangGraph, Anthropic, and other providers.
- Trace an LLM application: a full lifecycle tutorial, from prototyping through production.
- Filter traces: search and navigate large tracing projects.
- Log to a specific project: send traces to a named project instead of default.
After logging traces, use Polly to analyze them and get AI-powered insights into your application’s performance.
Connect these docs to Claude, VSCode, and more via MCP for real-time answers.